

WC-02/11: Expect the same confusion
WC-02/11: Expect the same confusion
It should end soon though.

When will the confusion end?
In a week or two, but hopefully after this week. In fact, I wouldn’t be surprised if we see a little green in the market this week.
Last week we said,
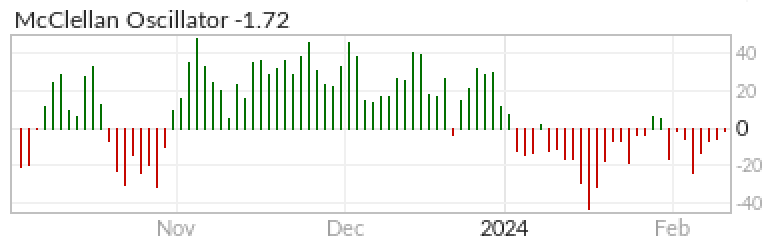
“Now the McClellan Oscillator is at -26.31 and I still believe it’s likely to continue negative, meaning that we’re likely to see some red in the market.”
So we saw that red. Now what?
Indicators are STILL forecasting mixed but slightly negative behavior.
On the flip side, the S&P has been less negative on average over the past few weeks. What goes up must come down, and vice versa when it comes to the stock market so it’s only a matter of time.
The McClellan Oscillator is now at -1.72, and pointing upward, giving us signs of hope.
This plus the fact that the S&P’s RSI is at 73.26, and struggling to be overbought, makes me hopeful.
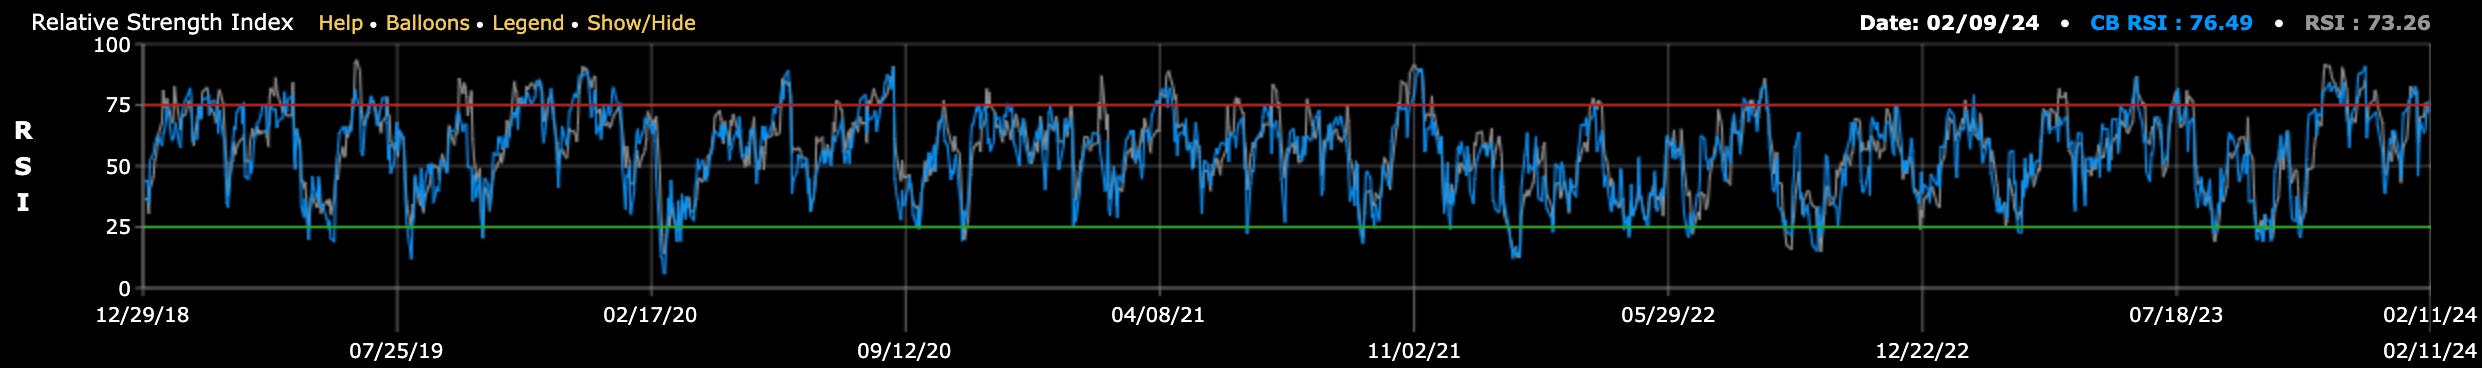
Zooming in, we can see that there haven’t been many times over the past 1.5 years where the S&P’s RSI has been overbought for THIS long.

Every day that it teeters around that level increases the chances of it dropping.
This is for two reasons: 1. it has to come down at some point, 2. there are very few instances of
Catalysts: None
I’ll explain why soon.
In short, Congress is being slow and the market doesn’t really care about indicators anymore.
By the way!
I’m VERY open to ideas for articles and research.
Please let me know if you have topics you’re interested in learning about more. I can;’t guarantee I’ll write a full report on them, but I’ll give it a look and probably write something if more than one person expresses interest.